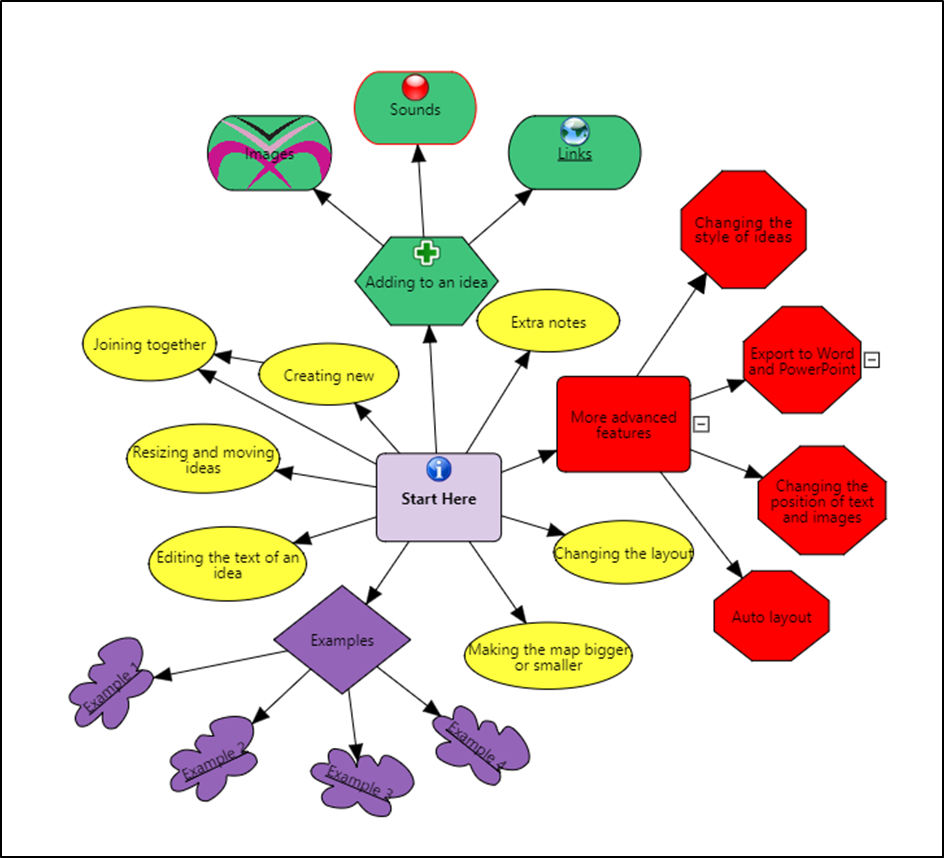
ClaroIdeas is an easy-to-use tool to support the creation and editing of concept or idea maps using visual components. It has been specifically developed to support people with wide age and ability ranges. We have tried to keep the complexity of the program down whilst still retaining the functionality of an idea map.
Overview
An idea map is a diagram used to represent ideas or concepts linked to a central key idea or concept. Idea maps are used to visualise, structure and classify ideas, and as an aid in organisation, problem solving, decision making, writing and study.

With ClaroIdeas Web you can quickly and easily create idea maps using a combination of words, symbols and pictures. You can record your thoughts and ideas as text and have them displayed in colourful, meaningful idea maps.
ClaroIdeas Web integrates fully with ClaroRead Chrome extension, allowing all text ideas to be spoken back in a human quality voice. Also, the save and load format is the same as ClaroIdeas desktop, so you can use your files in the web also.
You can enter additional notes for each node or idea.
Node tab

In the Node tab you can modify the style (i.e. shape and colour) of selected nodes of, if no idea is selected, the style of default nodes. Also, the font style of the text in the nodes can be modified in this section. There are buttons for image embedding and hyperlink creation, along with a delete button.
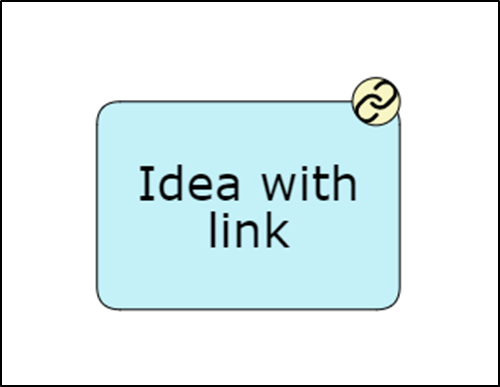
When a hyperlink is attached to an idea, a small floating node is displayed on the top right corner of the idea.

Clicking on that node navigates to the link in a new window, so that you don’t lose the map you’re working on.
Link tab

This tab allows you to change the style of the head of a link (i.e. shape and colour) of selected links of, if no link is selected, the style of default links. Also, the font style of the text in the links can be modified in this section. The is a delete button to remove a link connecting two nodes.
Diagram tab

In the Diagram tab you can change the background colour and/or the image that appears as background.
This tab is where the layout of the map is controlled from.
View tab

In the View tab you can set the zoom and other controls for the display of the map.
Side menu
New – Create new map
Open – Load map from local disc
Open Drive – Load map from Google Drive (web only)
Save – Save map to local disc
Save Drive – Save map to Google Drive (web only)
Export – Export map to local disc as DOCX (requires Internet connection)
Export Drive – Export map to Google Drive as DOCX (web only)
Help – Open help file